 Deutsch
Technology at work
Investigation of the effect of lightning strikes on polarization
Predecessors PM500 of the polarimeter PM1000 have been used by D. Charlton et al. for field measurements of state of polarization transients in optical ground wire, with time and location correlation to lightning strikes: https://www.osapublishing.org/oe/abstract.cfm?uri=oe-25-9-9689
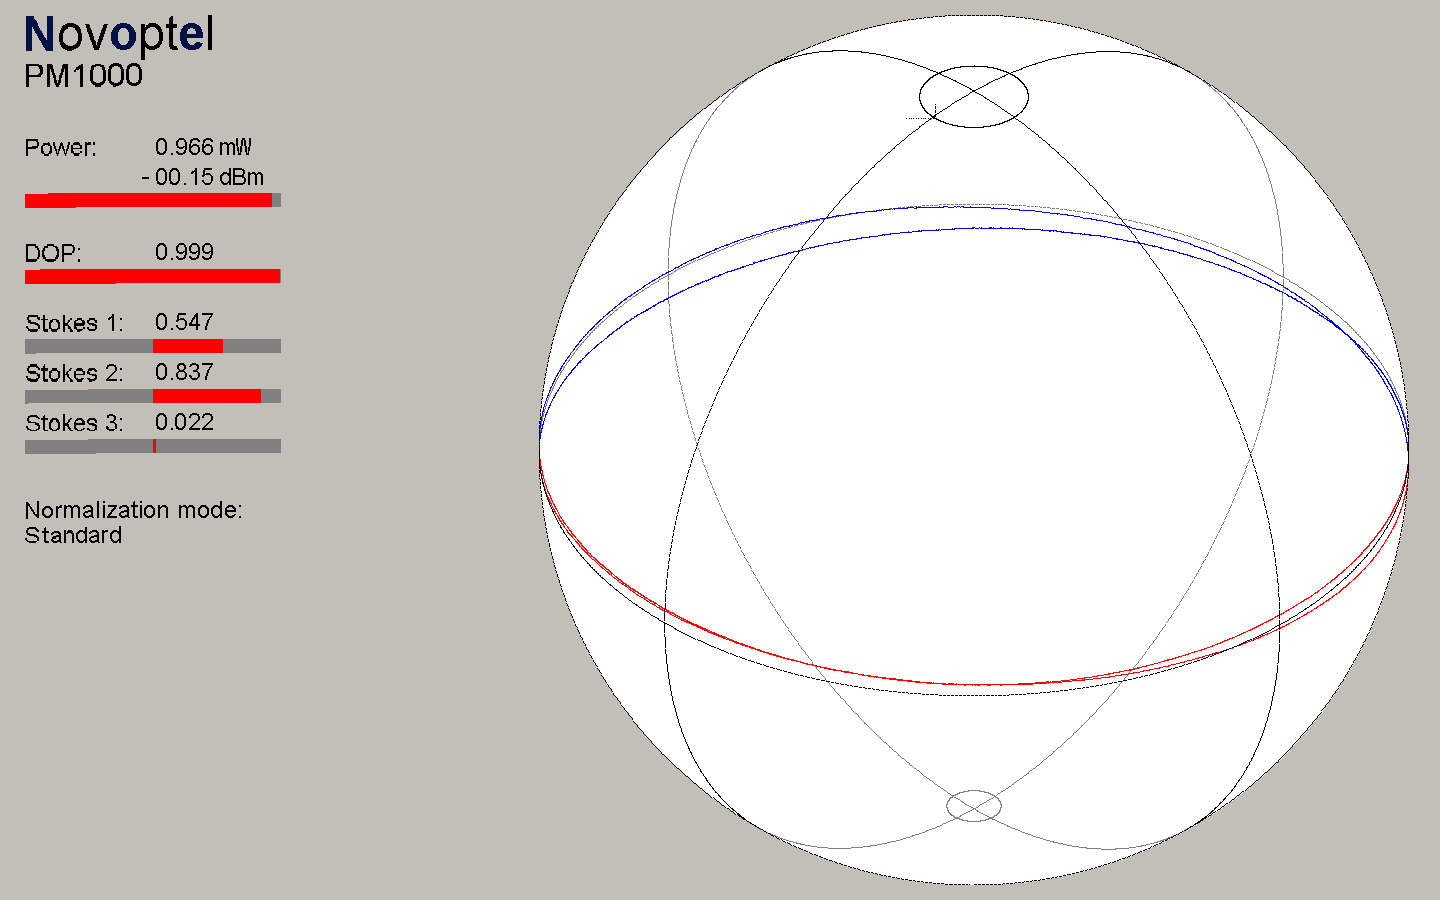
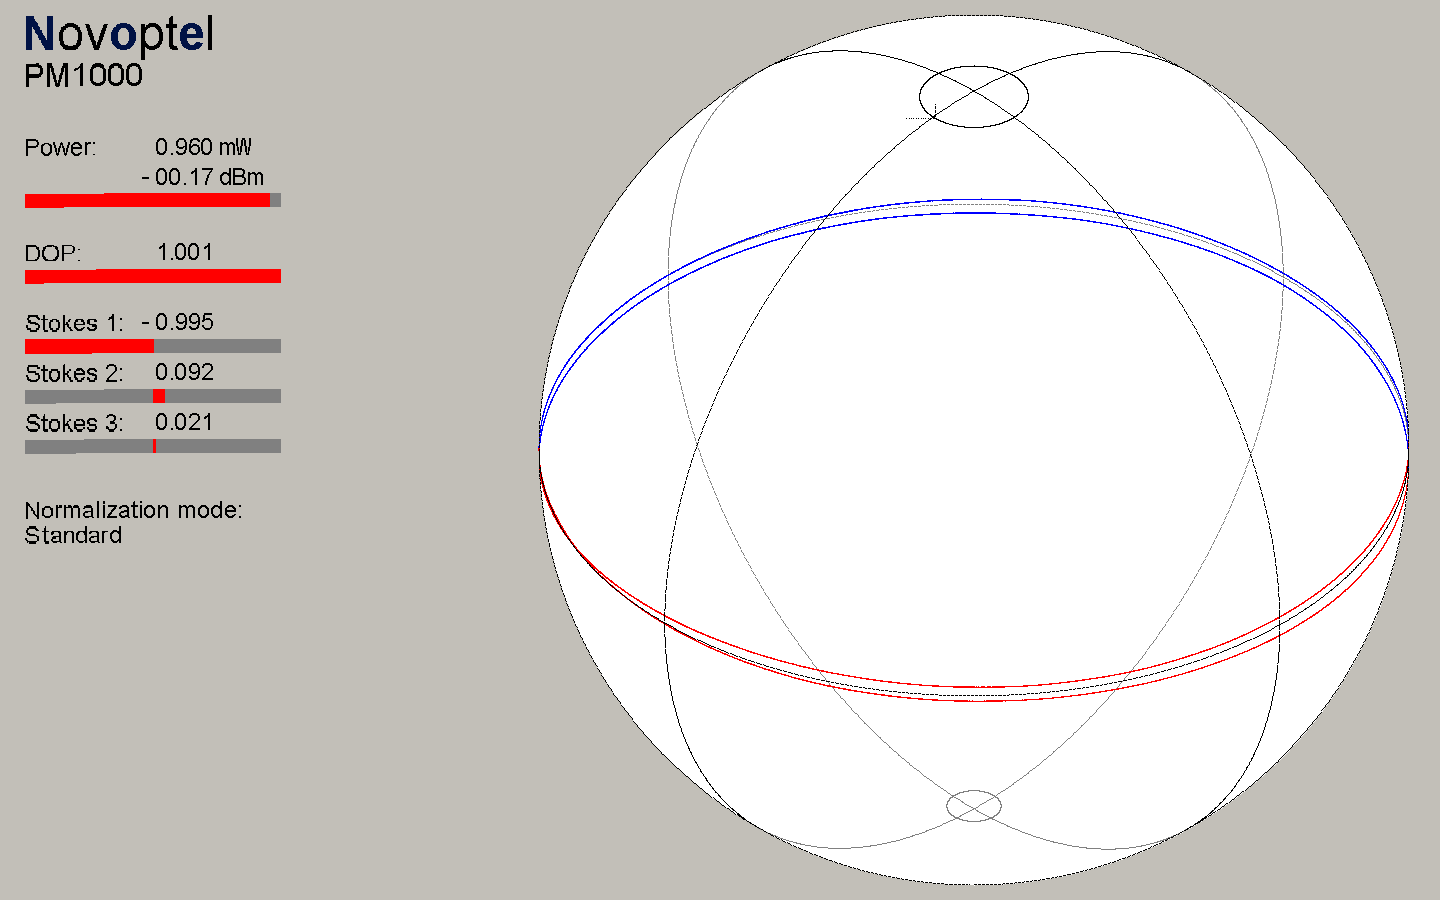
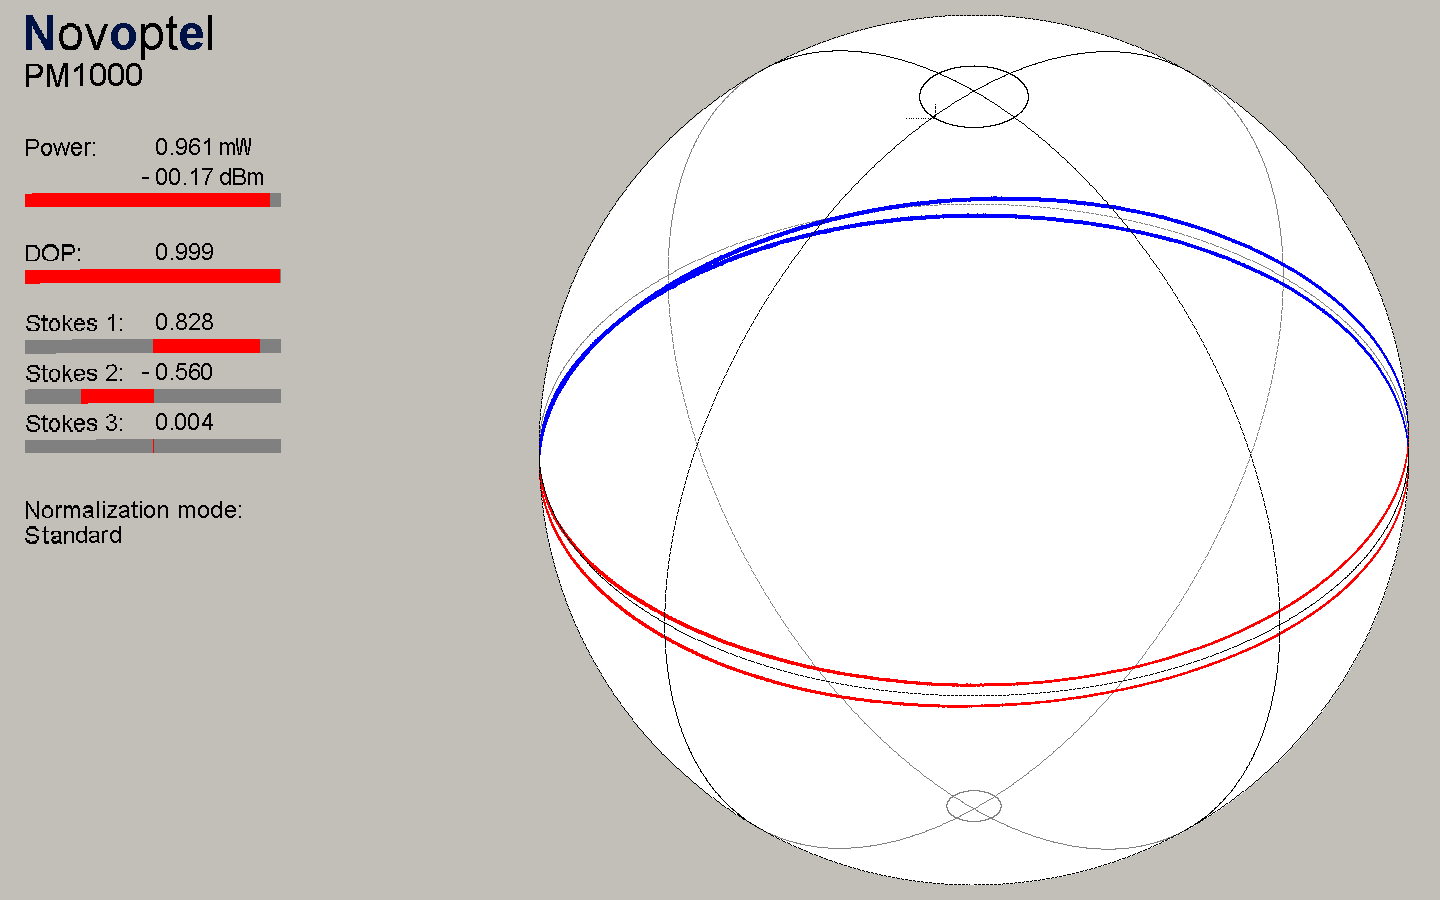
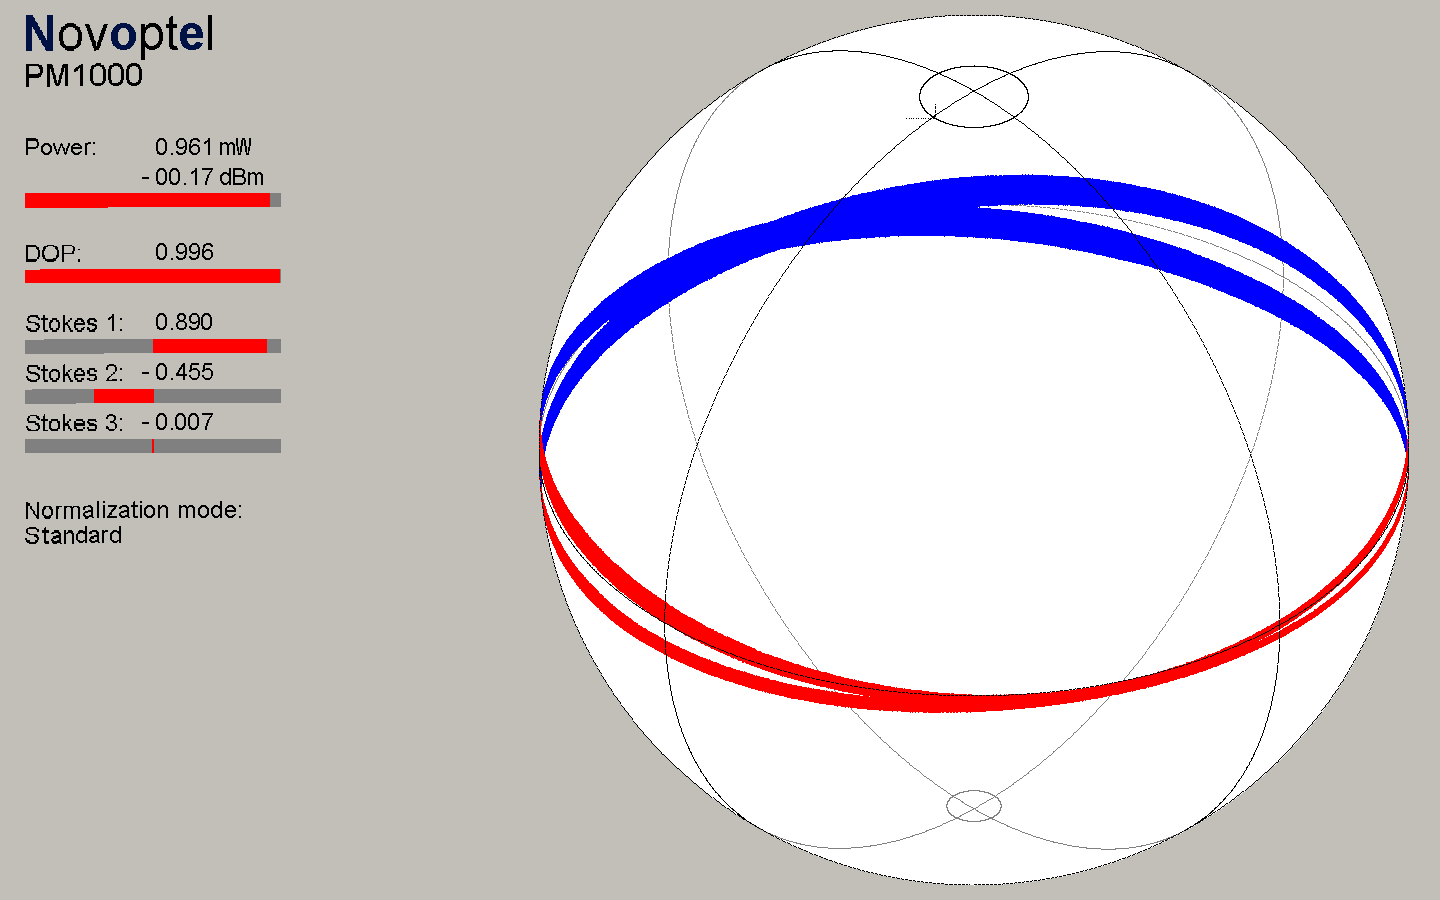
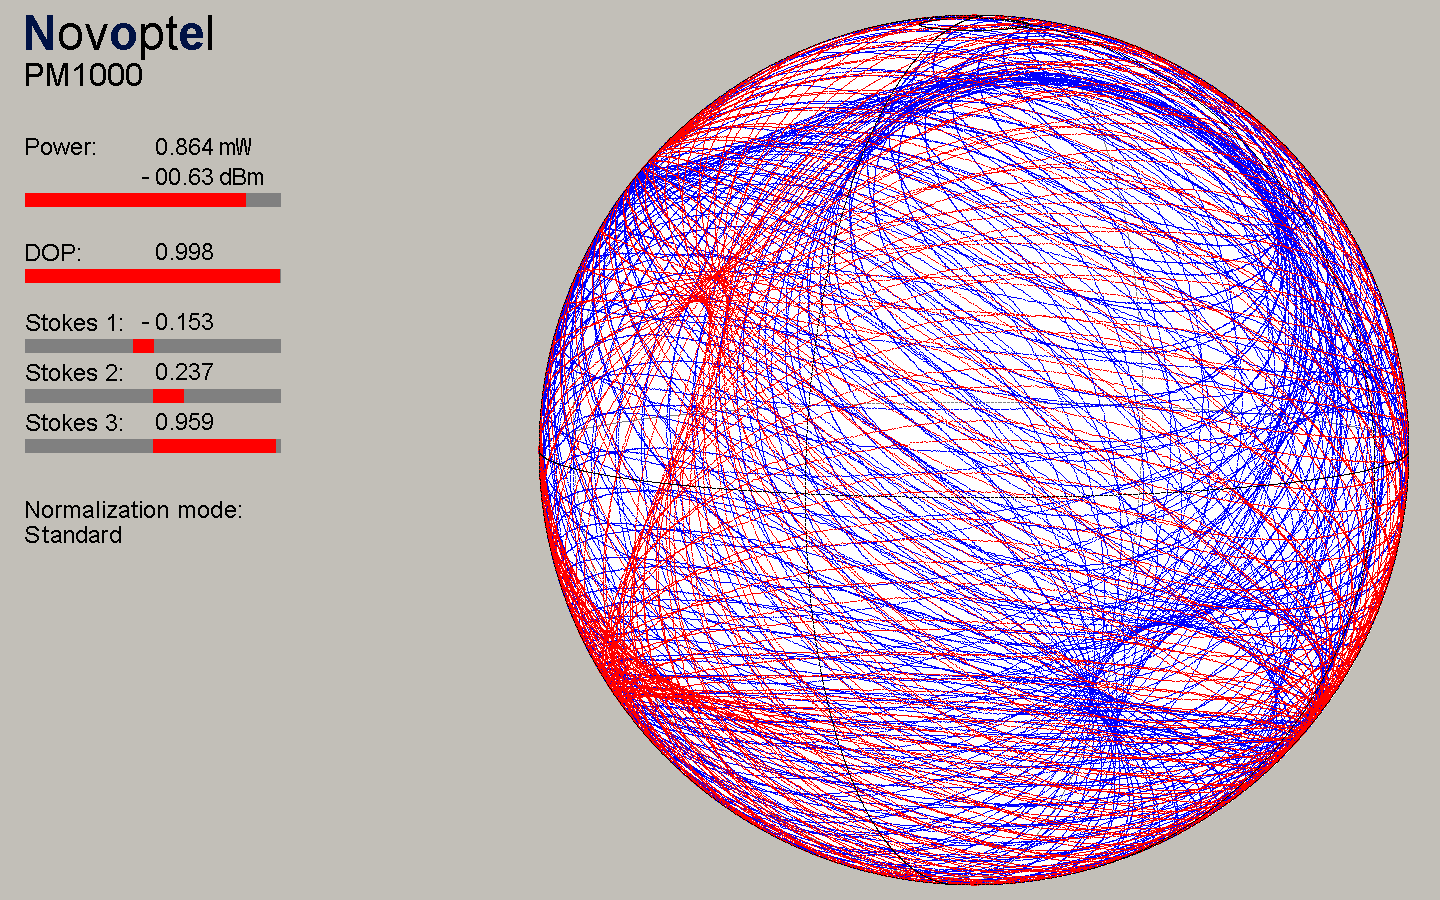
PM1000 records Poincaré sphere trajectories generated by EPS1000
 |
 |
|
 |
 |
|
 |
 |
|
 |
 |
|
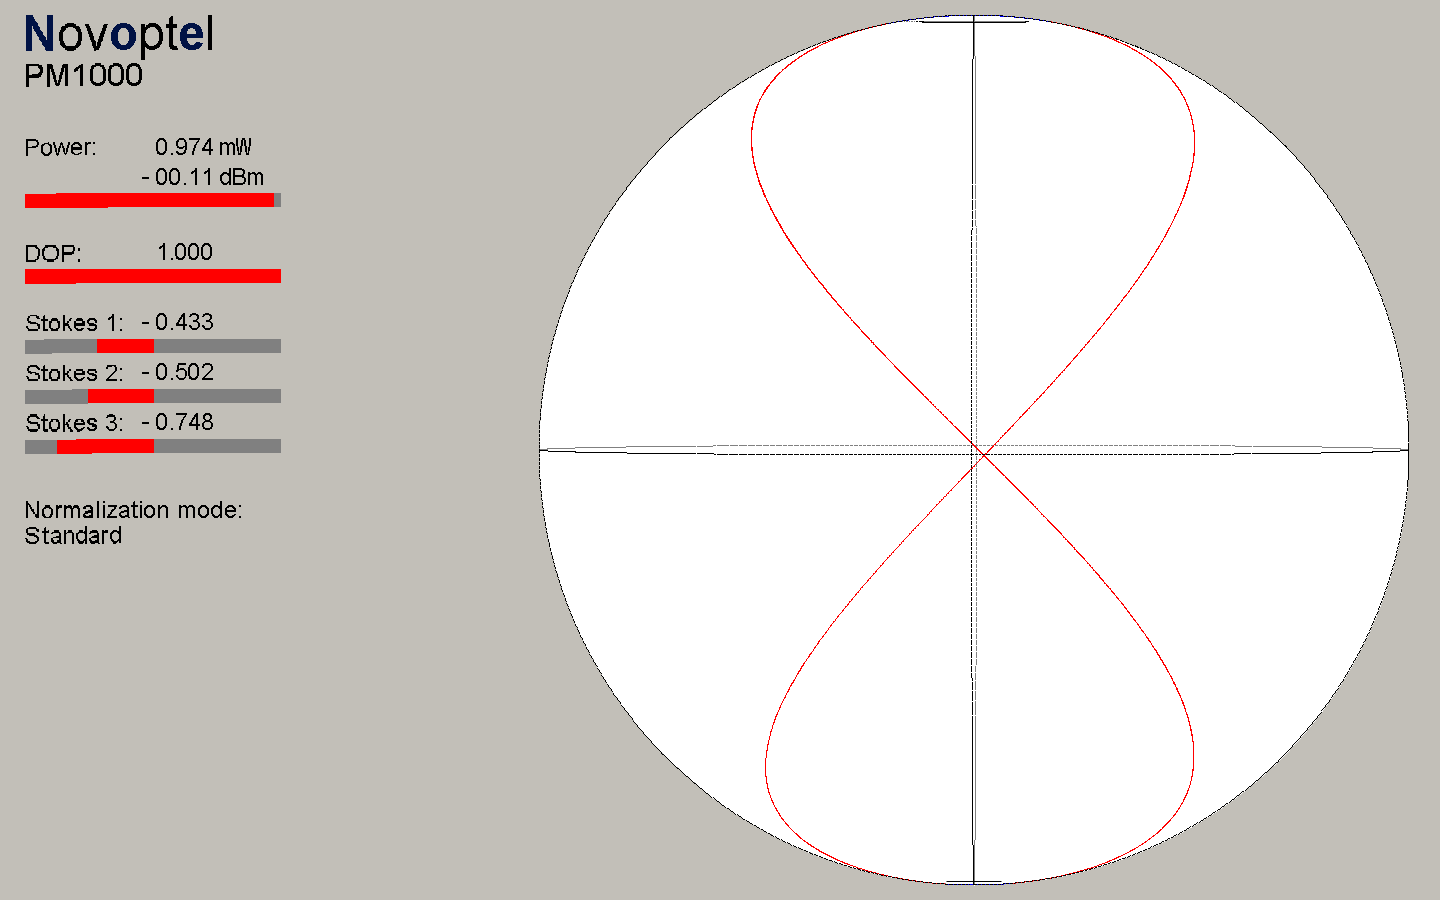
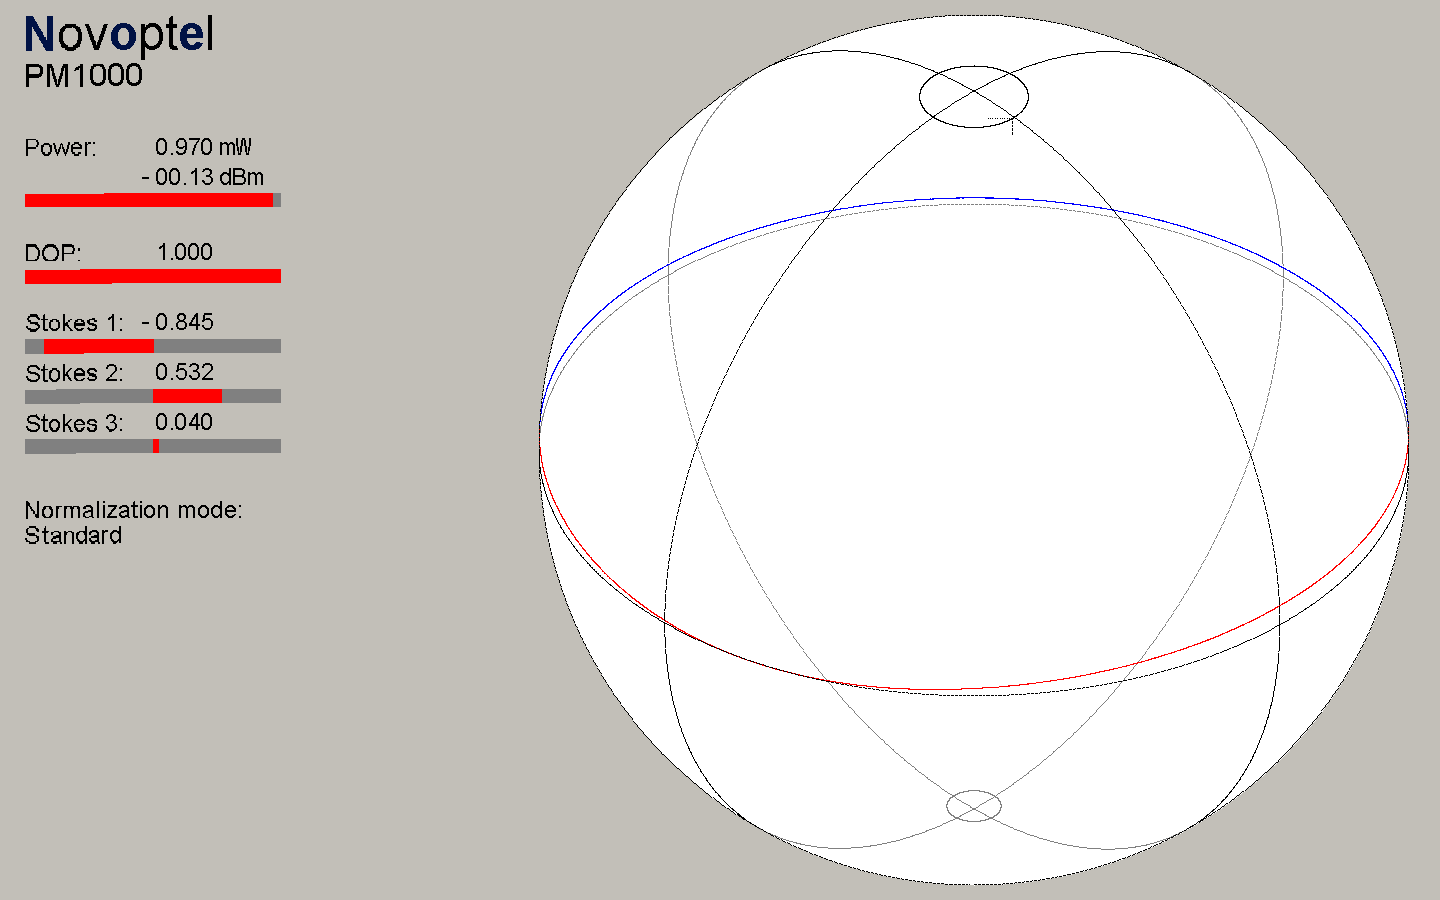
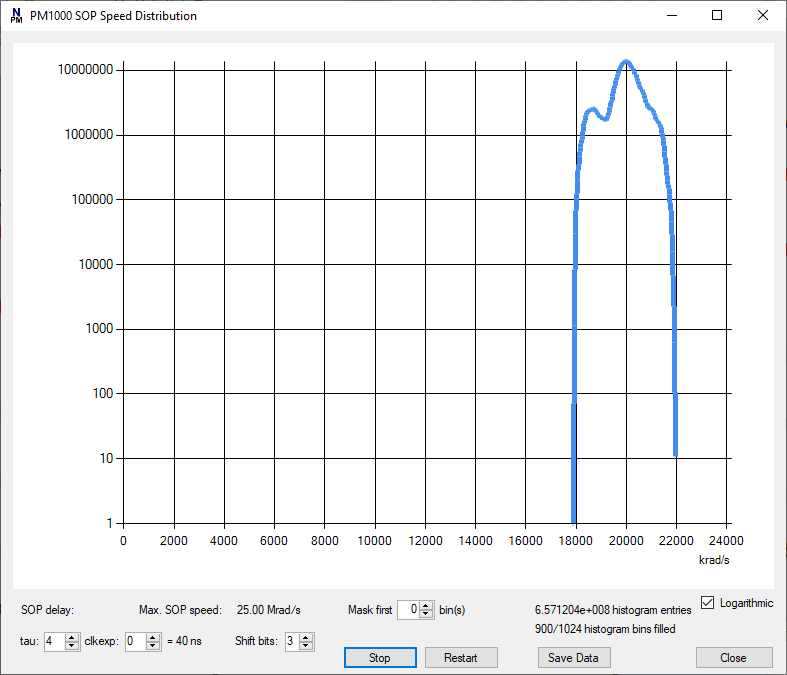
| EPS1000: HWP, 20 Mrad/s, linear input polarization | ... and corresponding speed distribution (logarithmic scale!), FWHM = 20 Mrad/s ±3% | |
 |
 |
|
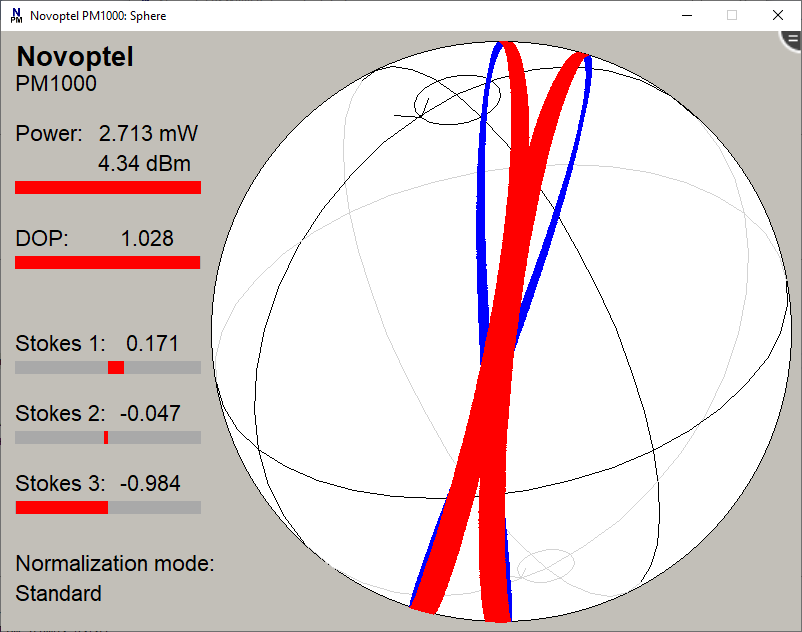
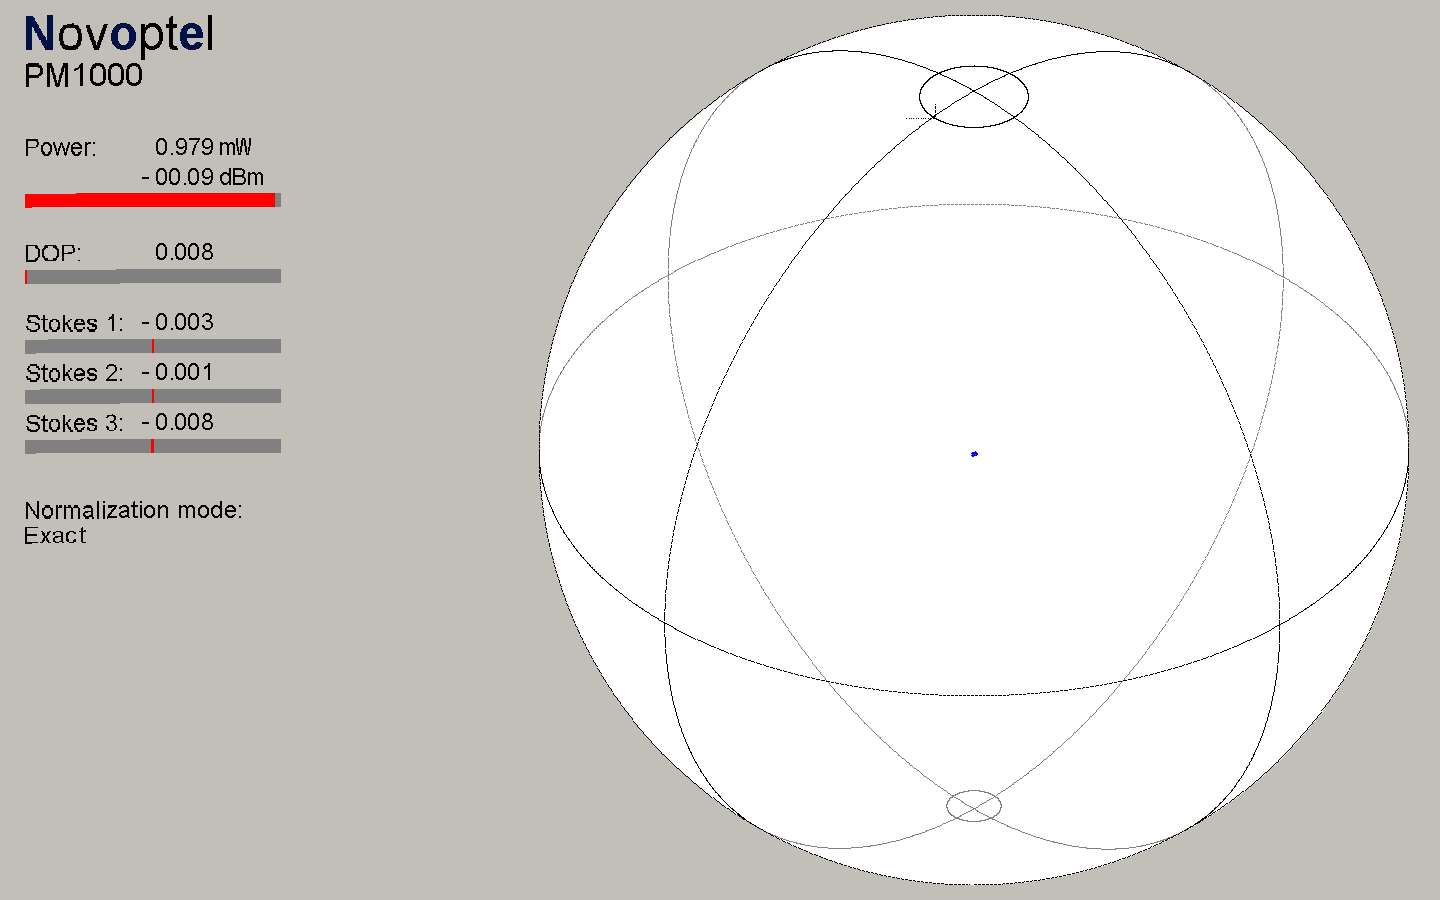
| Polarization is scrambled at about 70 krad/s speed by the 7 waveplates of the EPS1000. A PM1000 records this polarization in gated operation during 5 ms. Gating and triggering can be controlled by hardware and software. | Polarization is scrambled fast by the 7 waveplates of the EPS1000. In the PM1000 the averaging time is set to 10 ms and the normalization of Stokes vectors is set to exact. The depolarized light is hence displayed inside the Poincaré sphere. |
Internal triggering
The polarimeter PM1000 can record Stokes parameters continuously. At 100 MS/s the up to 4 x 226 measurement values in the memory (4 Gbit) cover a time interval of 0.67 s, or correspondingly more in the case of slower sampling. After an internal or external trigger event one half of the chosen memory space is still being written into, so that the trigger event lies in the middle of the recorded time interval.
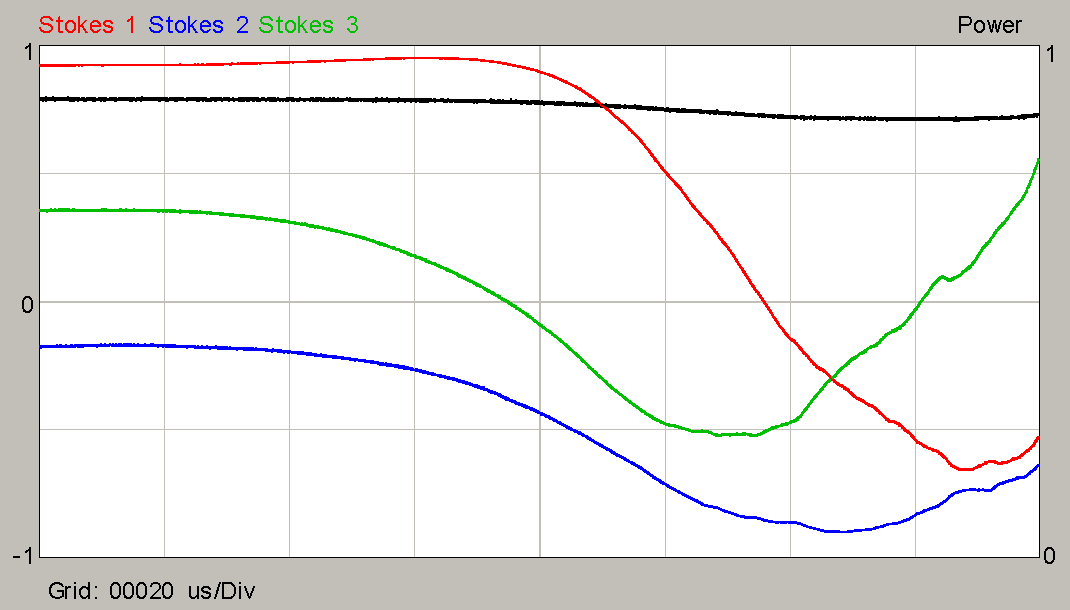
To create sudden polarization changes a hammer (0.3 kg) was dropped from a height of 2 cm on a fiber cassette DCM-40. The internal trigger was set to >0.1 rad polarization change in 10.24 µs, so roughly 10 krad/s speed.
Permitted polarization change and time interval can be adapted according to the expected event. Also, a certain deviation from a specified polarization can be chosen for triggering.
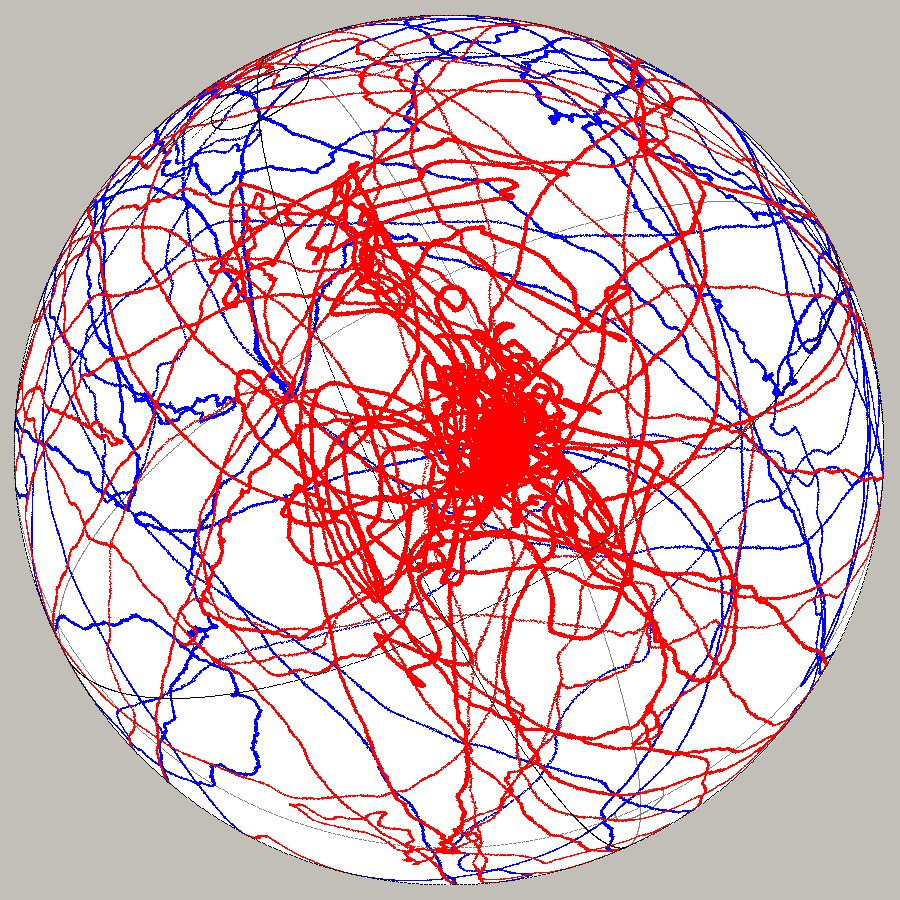 |
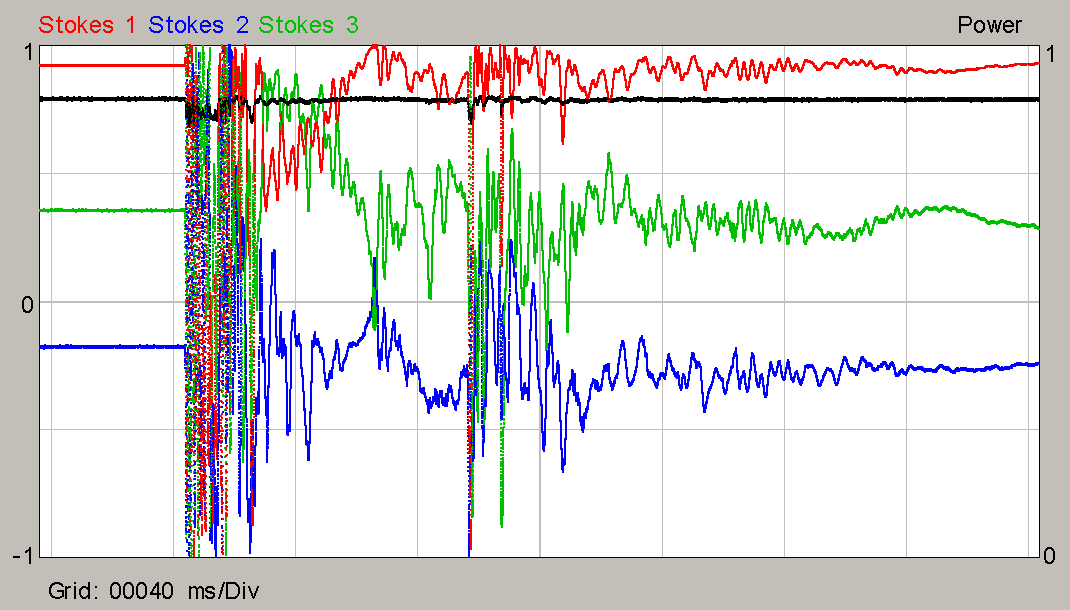
Left: The recorded polarization trajectory can be displayed and rotated on the Poincaré sphere. Here it has been rotated such that begin and end of the trajectory are in the middle at the front. Bottom: The same trajectory is now displayed in oscilloscope mode as a function of time, with |
|
 |
 |
Polarization extinction ratio (PER)
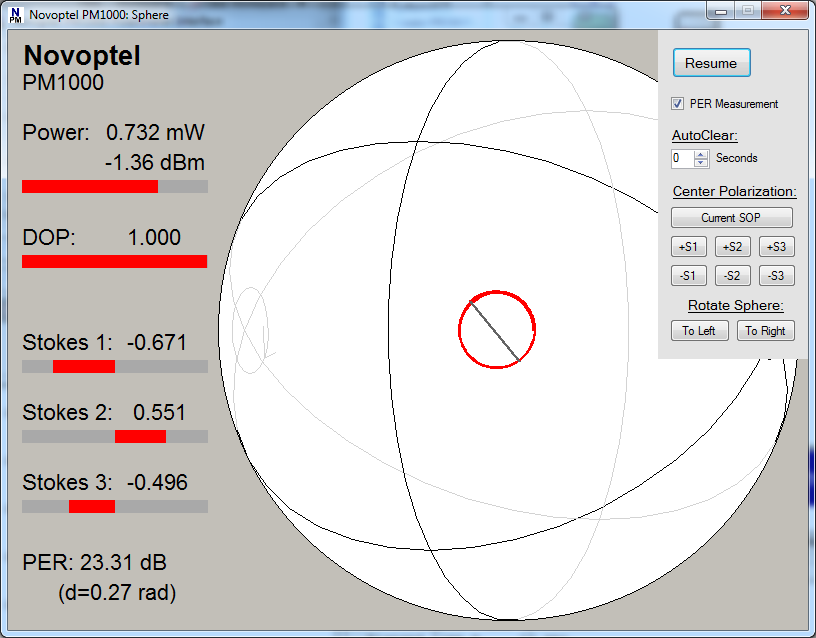
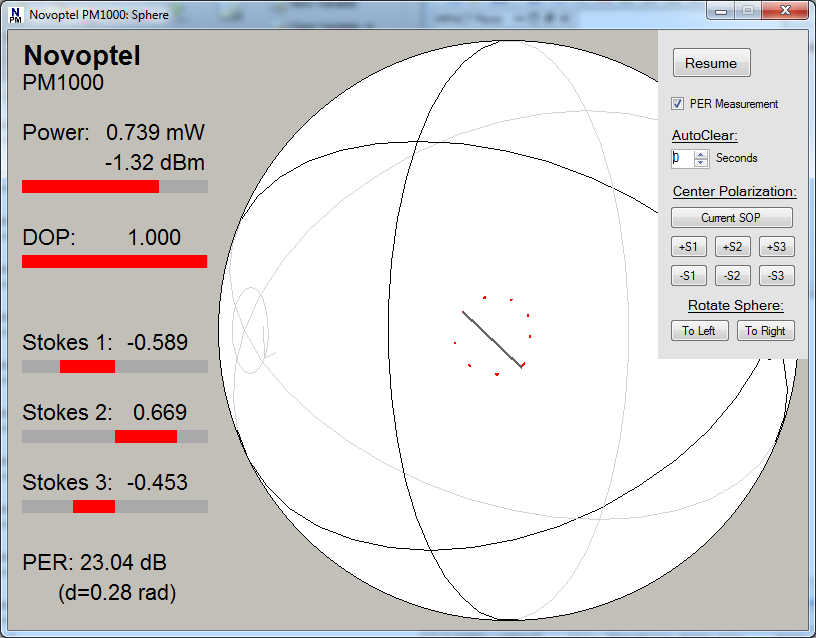
The PM1000 supports automated measurement of the polarization extinction ratio in a polarization-maitnaining fiber (PMF). To this purpose the maximum diameter of an object on the Poincaré sphere is calculated. One way to generate this object is to pull (see left Figure below) or to heat/cool the PMF. Another possibility is laser frequency tuning. To exclude tuning-induced polarization artifacts one can gate the PER measruement by a power threshold that needs to be surpassed (see right Figure below) or by a LVCMOS33 gating signal.
 |
 |
|
| PMF is being pulled to measure the PER. | Laser (ITLA) is tuned in 9 50-GHz steps to measure the PER. PMF DGD is 2.2 ps. Tuning-induced polarization artifacts are excluded by setting a power threshold. |
Time-resolved measurement of Mueller matrices
A PM1000 and an EPS1000 are configured as a PMS1000. The Mueller matrix of the device-under-test (DUT) is determined while various input polarizations are applied.
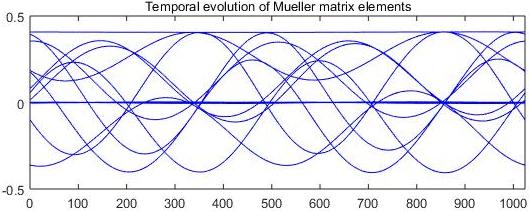
The halfwave plate of an additional EPS1000, rotating at 3.05 kHz (electrical) serves as a first DUT. 1024 Mueller matrices are recorded with 320 ns temporal spacing and are analyzed. Mean insertion loss (relatively large due to additional patchcords) and polarization-dependent loss (PDL) vary, as expected, with fundamental and doubled electrical driving frequency, respectively.
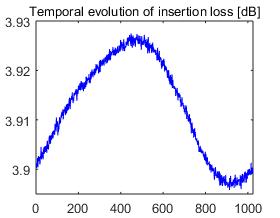
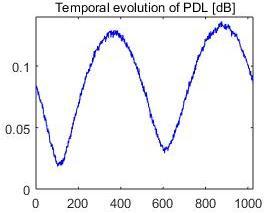
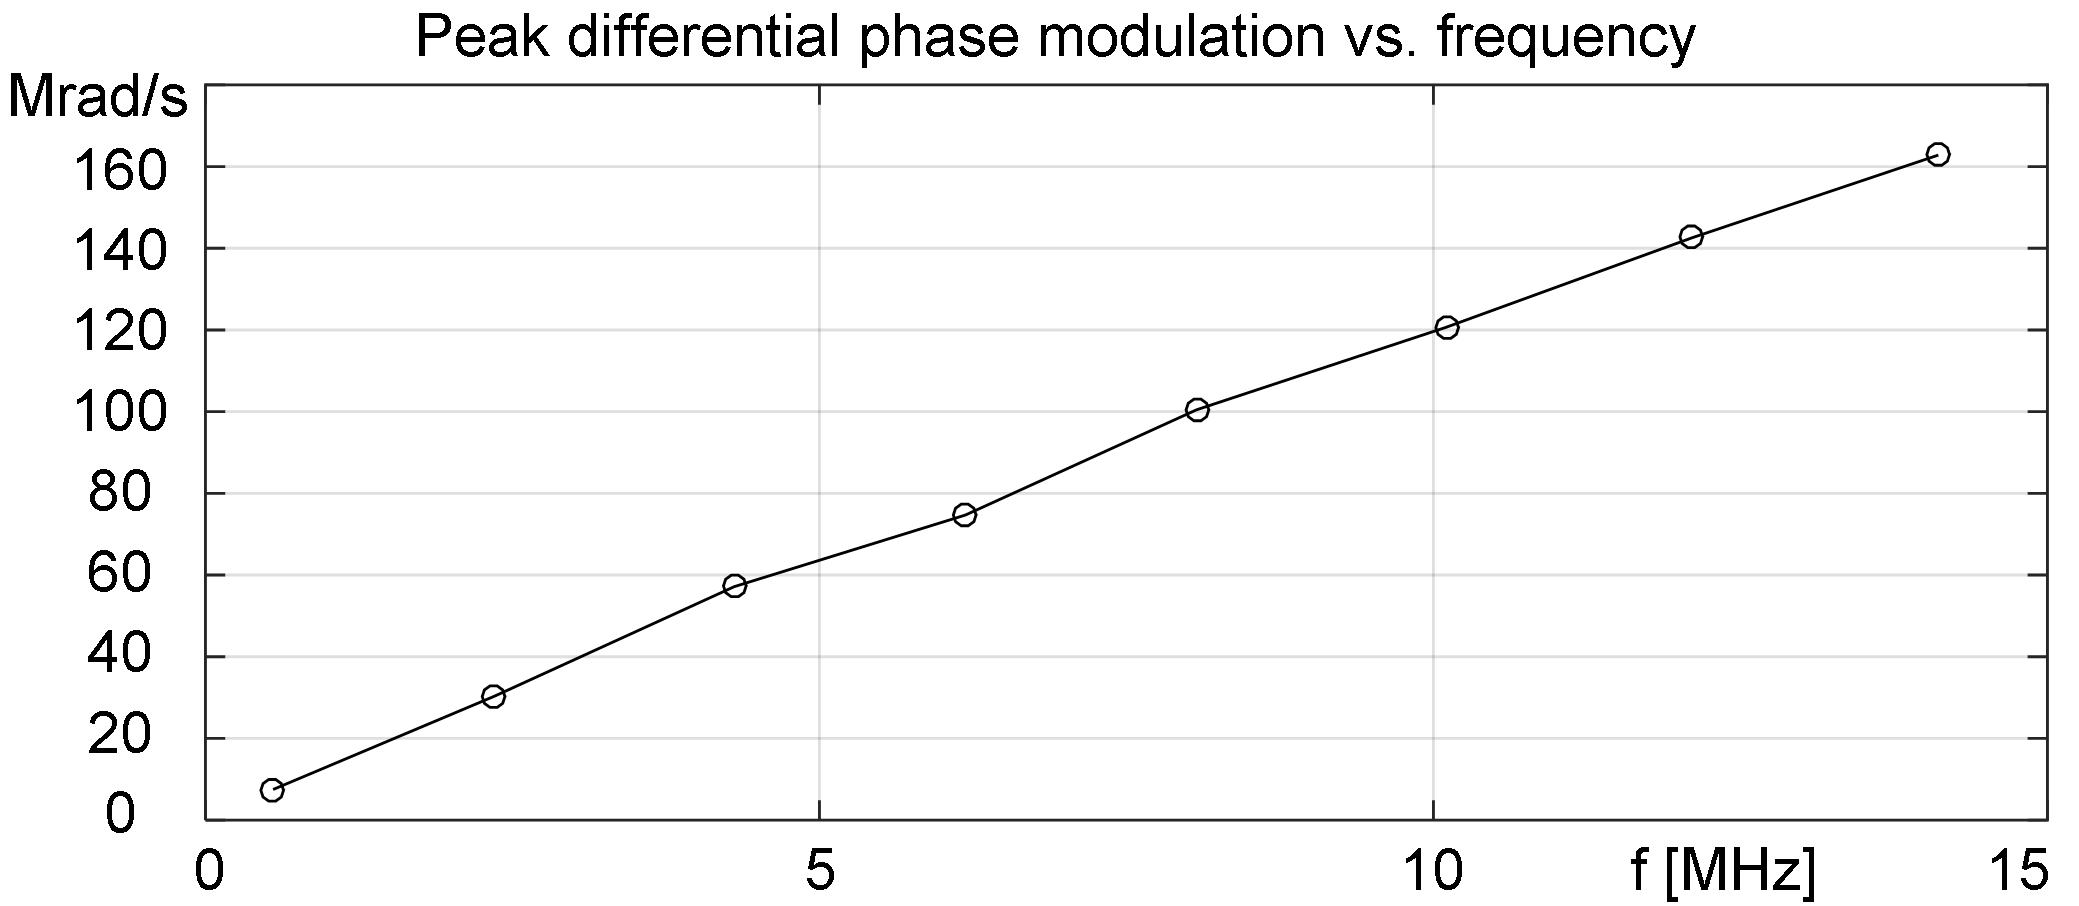
The temporal resolution of the PMS1000 (= PM1000 + EPS1000) can be increased to 10 ns or less. This way a LiNbO3 phase modulator as a second DUT is investigated. From the measured time-resolved Mueller matrices the differential phase modulation is extracted. Its peak values reaches 163 Mrad/s for sinusoidal modulation at 14.2 MHz.
PMD measurement <10 fs ... 10 ps with standard deviation ≤3 fs
A PM1000 and an EPS1000 are configured as a PMS1000. A grid-tunable laser LU1000 is scanned in 50 GHz steps over a 4.4 THz range of the C band. Mueller matrix and retarder matrix of the device under test are determined for each frequency. This way, polarization mode dispersion (PMD) can be measured with differential group delays (DGD) down to the low fs range and standard deviation of a few fs.
Pieces of polarization maintaining fiber (PMF) were tested, 6 times each. To vary polarization transformations from one measurement to the next, always one SMF connector was disconnected, rotated by different multiples of 360° and reconnected. Even the
Approximate
Differential group delay (DGD)
PMF length
meanstandard deviation
0 mm (no PMF)
3 fs1 fs
7 mm
12 fs1.5 fs
25 mm
34 fs3 fs
49 mm
66 fs3 fs
580 mm
801 fs2 fs
780 mm
1032 fs2 fs
2600 mm
3540 fs3 fs
7000 mm
9432 fs3 fs
With another, continuously tunable laser in the LU1000, DGDs up to the high ps range can be measured.
Differential group delay profile and polarization-dispersive structure of device under test
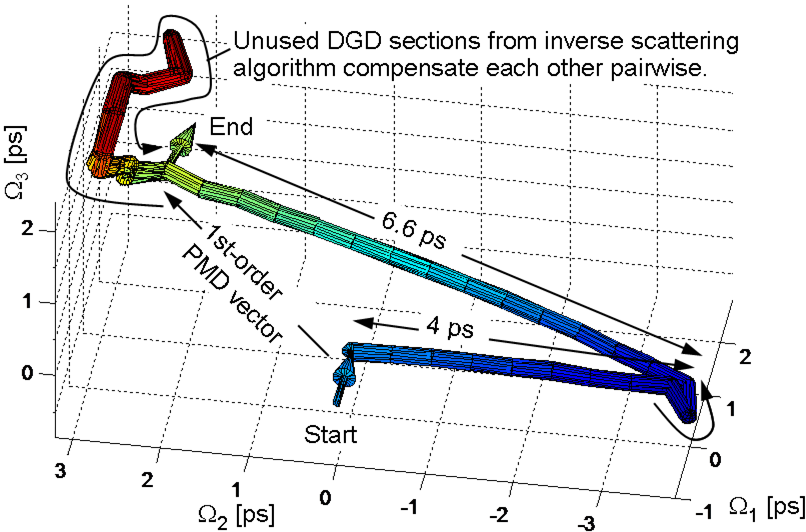
A PM1000 and an EPS1000 are configured as a PMS1000. A tunable laser LU1000 is scanned in 50 GHz steps over a 4.4 THz range of the C band. Mueller matrix and retarder matrix of the device under test (DUT) are determined for each frequency. An inverse scattering algorithm determines the directions of 44 elementary differential group delay (DGD) sections with